 That big orange heavy thing is what my road racer pal calls our latest test vehicle, a 2007 Grabber Orange Shelby GT500.
At nearly 4000lbs, it is heavy, and it sure as hell is orange, so I guess I shouldn’t be angry. Still, I can’t help but think he’s bitter from the time he spent getting beat by Mustangs in the Grand Am series. Getting beat by “The big heavy things with all the power…”
Whatever he might think, I like it, and it makes a perfect addition to ID’s stable of test vehicles.
This article will detail our testing, and should be a good read for any of you interested in Fords, OEM control unit tuning, fuel injection, or sarcasm.
5-15-2012 – Initial Thoughts
I bought the car from someone I trusted, so my initial test drive lasted all of 5 minutes, and amounted to “Yup, it’s a nice car just like you said, let’s get it loaded and get some dinner.”
After I got it home, I took it for a drive to get a feel for it. In the lovely 95 degree spring weather of Phoenix, I put my foot in it and it rattled immediately, so I decided to empty the tank and fill it with race gas.
Since I was too lazy to pump the tank, I waited until the next day and made the 50 mile drive to the shop to burn some fuel.
Several things became apparent during the drive.
1. – The drivability sucked, with a particularly nasty flat spot around 1500 rpm where the engine would audibly misfire.
2. – The Ford Racing suspension was very well done, with superb shock valving. (In the history of the world, no one has ever heard me say that before!)
3. – The gas mileage sucked.
4. – The 1000 watt “Shaker” stereo was the most awful thing I had ever heard. Even AM radio was hard to listen to.
In spite of my complaints, it struck me as a nice vehicle, and I was already thinking of it as “my car” instead of just another test mule. This is bad news, because it’s a sure bet that business funds will get spent in the name of “research and development” when in fact it’s just an excuse to buy cool shit for “my” car.
5-23-2012 – Testing the Limits of the R&D Budget
I hope no one is offended when I say that the stock GT500 wheels are damn ugly. It’s as if someone at Ford decided the car was too cool with its Le Mans stripes, throaty exhaust, and muscular body lines, and so they fucked it up with a set of ugly wheels just to remind us that it’s a $40,000 car.
Since the stock wheels had to go, and I couldn’t come up with a way to justify new ones as part of the R&D budget, I created a new budget. The promotional budget. Yes, that’s right, the promotional budget. Since Injector Dynamics doesn’t sponsor forums, or buy magazine ads, I have decided we need to promote ourselves by showing up at some local events with a bad ass car.
And every bad ass car needs a set of bad ass wheels right?
Enter Forgeline Wheels
These guys typify bad ass, with a selection of gorgeous, well-engineered wheels that will survive seasons of abuse on the race track, and weigh less than any comparable wheel.
While some of you may have seen a Forgeline wheel here and there, you probably didn’t know that these guys specialize in racing wheels. Racing wheels designed to be light, rigid, and durable.
They didn’t appear from nowhere with a pretty website, and a shiny new CNC machine cranking out trendy tire jewelry. They earned their reputation in endurance racing where wheels are subject to the extremes of load and fatigue cycles.
As a result, their wheels have a very functional, race bred look, unlike most of the “bling” wheels on the market.
When I called, I was happy to find that they had already worked out fitment for the Mustang, and were able to spec width, offset, and tire sizes. In addition, they could ship them with tires mounted, balanced, and ready to bolt on the car.
Pretty cool huh?
I ordered the GA1R in silver, just as it is shown in the picture below.
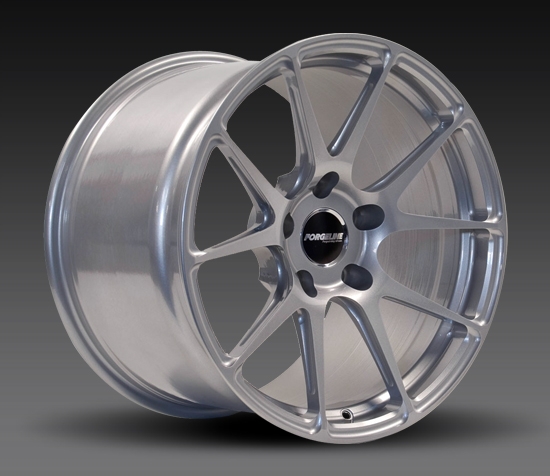
The GA1R is a one piece wheel, carved from a big-ass forging, which means no bolted joints, and no bolted joints means an exceptionally light, rigid structure.
The 19″X10″ front wheels tip the scales at an unbelievable 19.1 lbs, and the 19″X11″ rear wheels at 19.6 lbs.
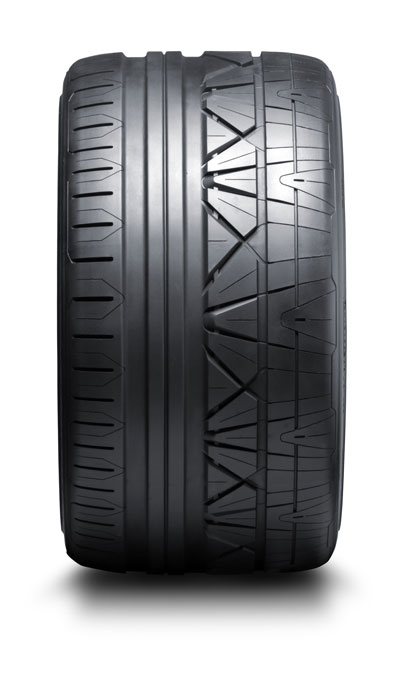
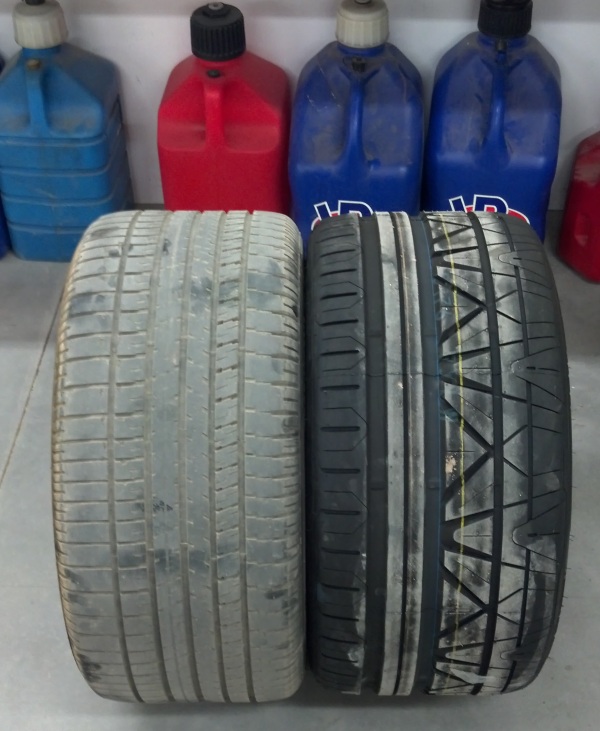
I chose 285/30 Nitto Invo’s in front, and 305/30 Invo’s at the back.
6-7-2012 – Budget Busting 101
Anyone notice that the new wheel/tire combination is approximately 1″ smaller in diameter than stock?
Well I did, and that got me thinking about dropping the ride height an additional 1/2″ to maintain an appropriate tire to fender gap.
As happy as I was with the valving of the Dynamic/Ford Racing shock package, it would have to go in favor of adjustable coilovers so that I could get the exact ride height I was looking for, along with correct corner weights.
Being a cheap bastard most of my life, my previous approach was to build a set of coilovers around a bolt-on Bilstein shock, modified with a schrader valve so that I could open it up and valve it to my liking.
There is only one problem with this approach: It is very time consuming.
Clearly the coolness of proper ride height and “stance” justified a bolt on double adjustable coilover kit with remote reservoirs right?
OK, let me justify…explain. Coilovers are a must to achieve proper ride height. Adjustable dampers are a must because there is no way in hell I will be happy with someone else’s idea of optimum damping, and so I at least need a knob to twiddle. Furthermore, if the valving sucks so bad that no amount of adjustment will make it acceptable, I need the ability to take them apart and valve them to my liking.
As it turns out, Eibach USA has a kit that satisfies all the above requirements.
Enter Maximum Motorsports, one of a dozen vendors who offer this kit for sale.
If a dozen vendors offer it, why did I choose Maximum Motorsports? It goes something like this: I called Greg Banish of Calibrated Success and asked him to recommend a non-douchebag suspension supplier specializing in Mustangs.
His response? “Call Jack at Maximum Motorsports, he clearly belongs in the non-douchebag category.”
I didn’t have time to call Jack and name drop, but I did have time to whip out a credit card and order this from their website.
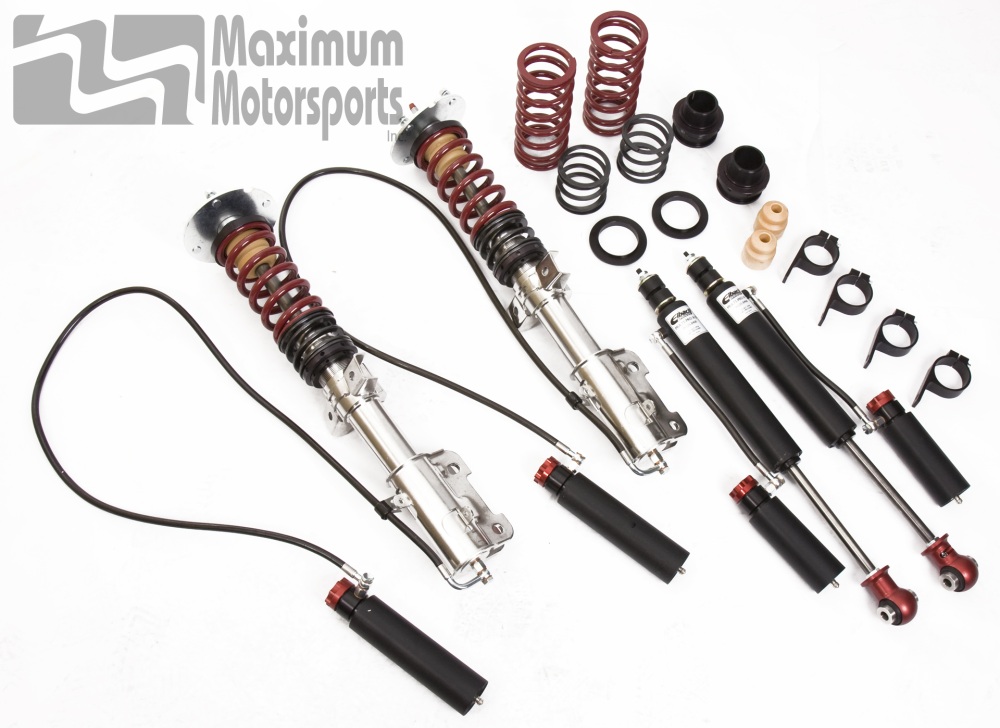
Looks cool, eh? Lots of shiny things, and knobs to twiddle…
I also ordered a set of Maximum Motorsports camber caster plates, also shiny with lots of things to adjust.
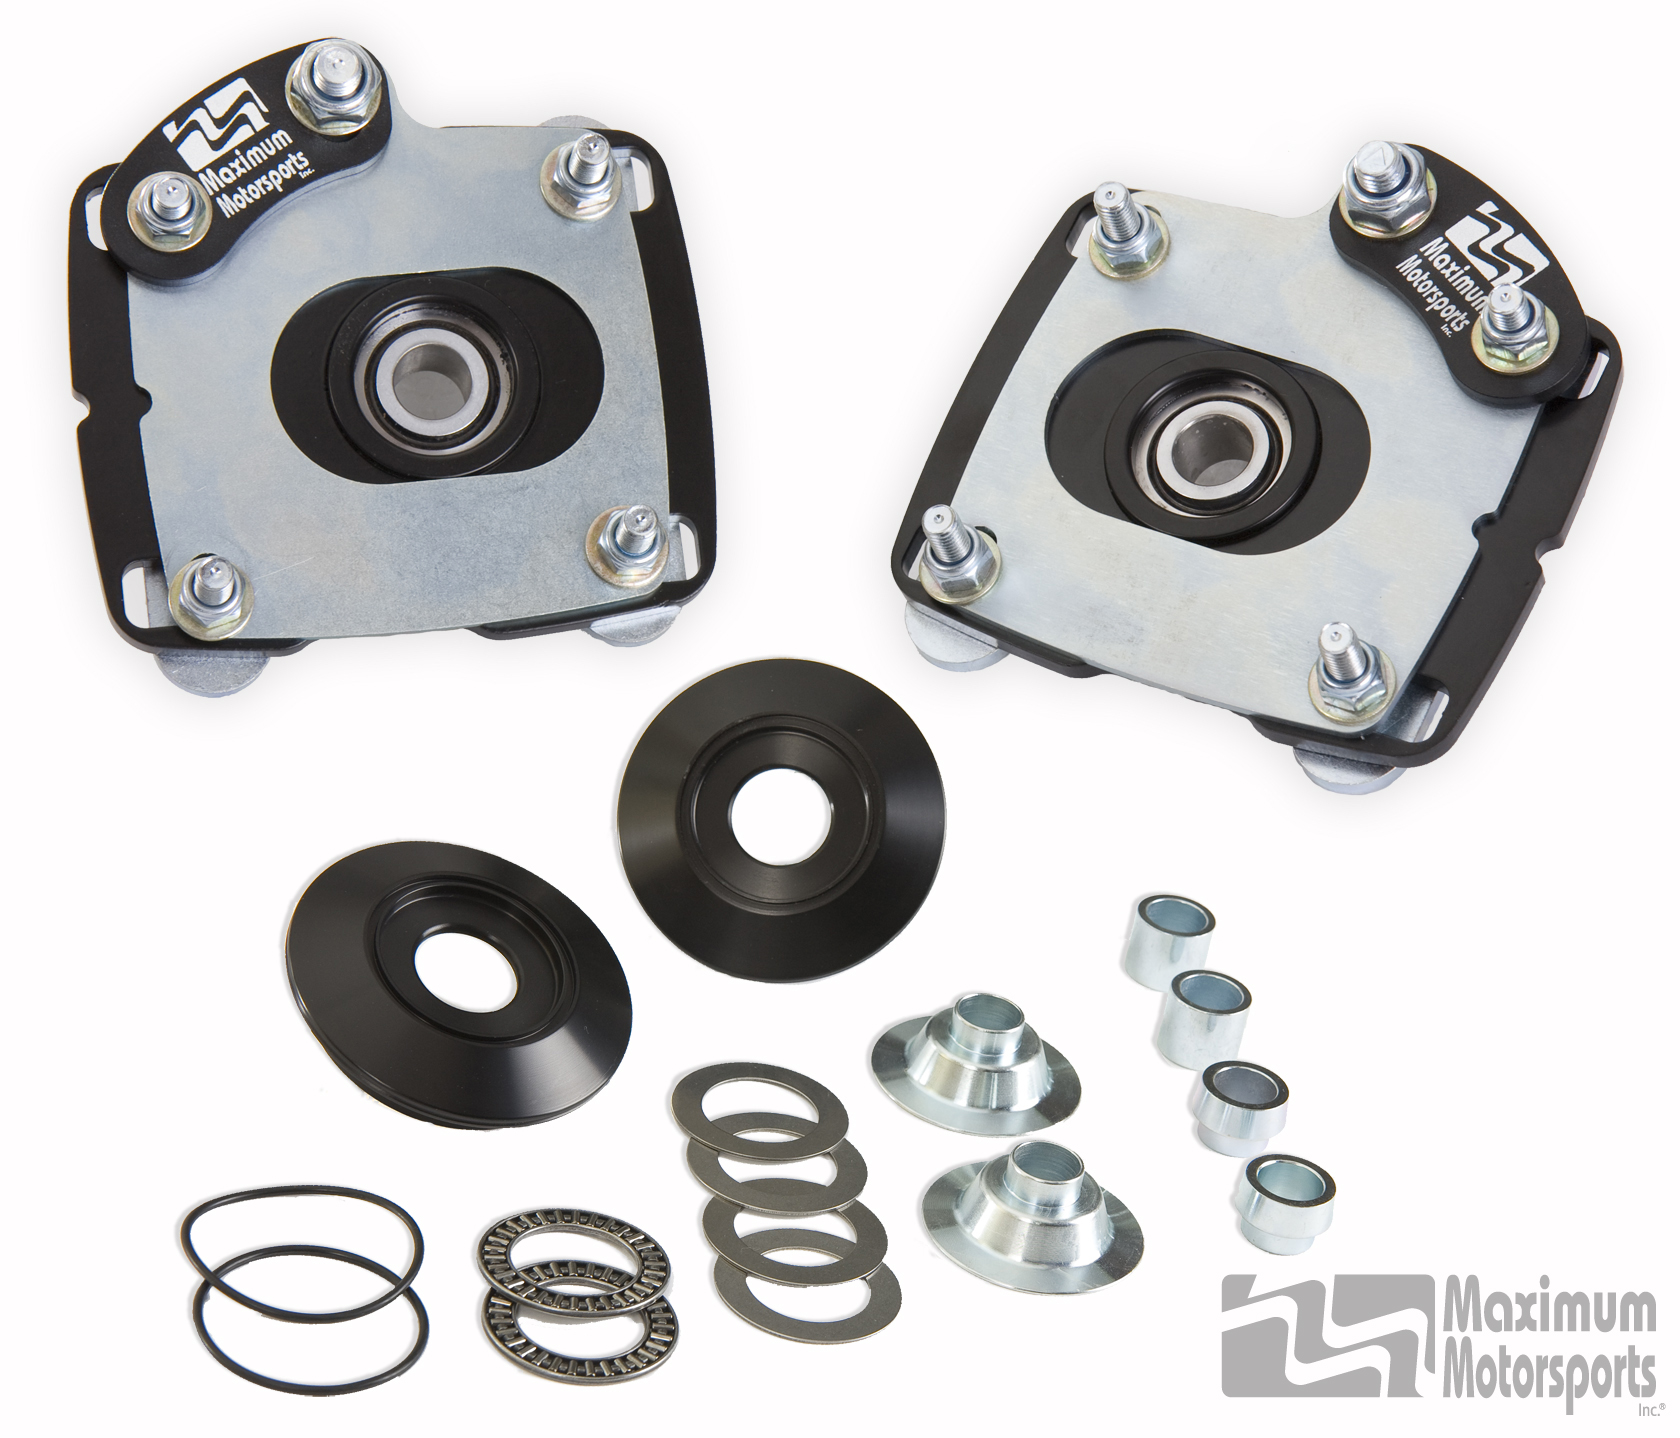
6-11-2012 – Are You Ever Going to Tune That Thing???
Oh yeah, we’re an injector company, and my job is to design/test/validate, which is the whole point of the R&D budget. I nearly forgot.
Any of you guys know Paul Meister from Torq Speedlab?
Paul is a guy that likes to do things right, and so I contacted him shortly after picking up the car.
For some reason Paul likes us, even though we take a lot of his money in exchange for fuel injectors. I’m not sure how he pulled this off, but after contacting SCT on my behalf, he surprised me with an SCT programmer and software package for a very small amount of money.
Since my R&D budget was sure to take a beating, I appreciated this immensely. After contacting SCT myself and thanking them, I got a response that surprised me.
They said that accurate injector data made the job of tuning easier, and they appreciated the work we put into it. Simple as that.
So now that I have the car, the software, and presumably the know how, we can start testing and tuning.
But first, let me tell you about the injectors. Would you think it ironic if a car that Injector Dynamics purchased for testing was equipped with a set of drilled stock injectors?
If you don’t immediately see the humor in that, you probably haven’t read the now famous Drillbits and Dipshits article where I put to rest a few of the myths perpetrated by my favorite dipshit injector driller.
And now I own my very own set of drilled injectors…
So what does that mean to the tune on this car? Follow along and you’ll see.
For starters, the car is equipped with a 3.4L Whipple making 21 lbs. of boost, Kooks long tube headers, 3″ high flow cats, and 3″ pipes all the way out through Magnaflow mufflers. Shortly before I bought it, it registered 800+ HP on a Dynojet running race gas.
Since this is a test mule, it will always run race gas, but that doesn’t change the fact that I need to get the damn thing through emissions before I can register it.
While waiting for my SCT tuner and software to arrive, I plugged in my el cheapo Autozone scanner and found several of the monitors in a not ready state. In the state of Arizona, you can pass with no codes, and one monitor in the not ready state, so I had a bit of work to do.
As ID dealers Paul at Torq, and Shaun at AED were quick to point out, the rear O2 sensors had been turned off, and the simple act of turning them on, and completing an OBDII drive cycle might get the monitors to show ready.
It was a pleasant thought, but it turned out to be a bit optimistic. As I was driving in stop and go traffic, watching the monitors switch to the ready state one by one, it threw a pending code PO420“Catalyst System Efficiency Below Threshold (Bank 1)”
The Freeze Frame data showed the bank 1 short term trim at 17.1%, and the bank 2 trim at 6.2%. NICE!!!
The unusually large spread between banks was probably due to the system overreacting to the Bank 1 misfire, but the SCT log shows an ugly spread between the two banks through most of the operating range, with the average being about 6% during the course of a 15 minute drive.
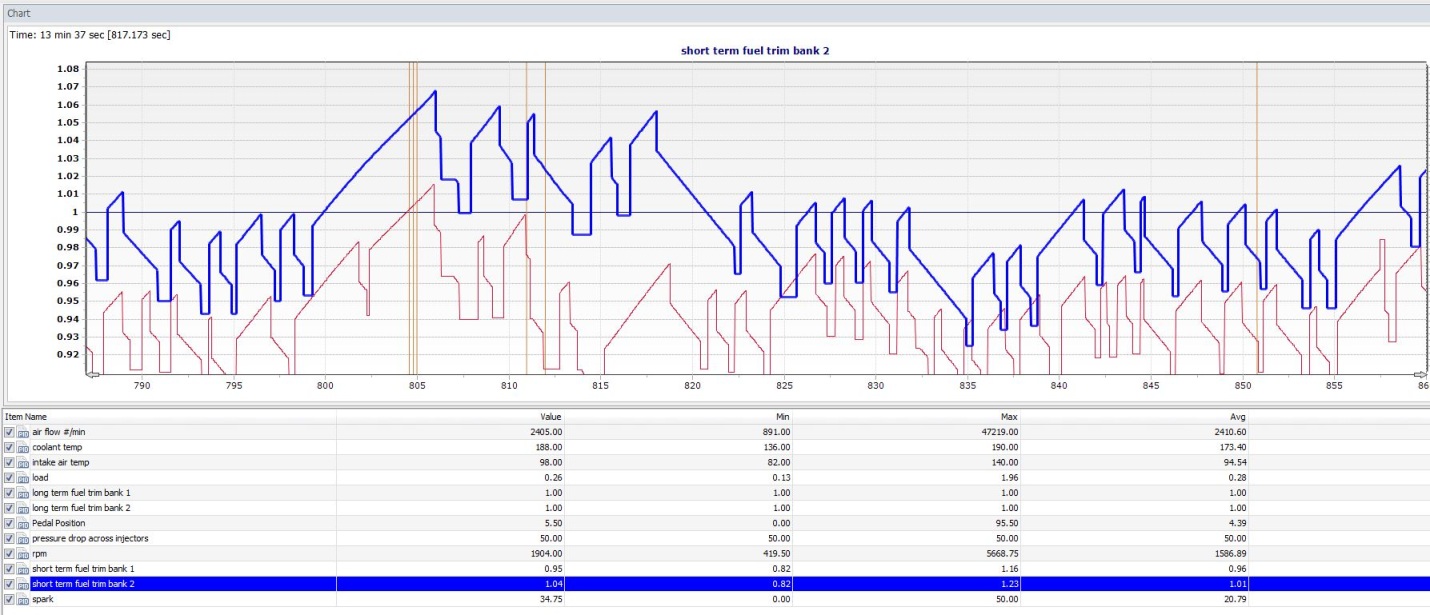
Maybe the Bank 1 injectors were drilled with a different bit???
6-19-2012 – A Mind is a Terrible Thing to Waste
Ever wonder why the big name tuners pay to learn from a professional? Because factory systems are complex, and we need a thorough understanding if our tuning is to progress beyond the “poke it with a stick” method.
Enter Greg Banish from Calibrated Success. Greg is an OEM calibrator, and he knows a thing or two about how these systems work.
Get out your checkbook, and he will be happy to pass this knowledge on to you through one of his books, DVD’s or classes.
Or…you can get some free morsels by following this article!
I asked him to take a moment to explain how the catalyst test works. Here is his response.
Catalyst monitor diagnostic operation explained in 3 minutes by Greg Banish of Calibrated Success.
In order to explain this best, we need to look at raw O2 voltage signals both before and after the catalyst. The front O2s should be switching pretty rapidly as we toggle around stoichiometric mixture at idle and cruise. The downstream O2 signal should be much smoother. This is because a working catalyst is actually a sponge for oxygen, damping the release rate of oxygen to the downstream exhaust and O2 sensor. There will still be switching of the rear O2 sensor, but at a frequency that is much lower than that of the front.
The Catalyst diagnostic is looking at the ratio of front switches versus rear switches (or vice-versa, depending on how they wrote the code) and coming up with some ratio. If this ratio is 1:1, then the rear O2 is moving exactly as the front and the catalyst isn’t doing anything: FAILED TEST! If the rear O2 is switching, but at a frequency much less than the front, the catalyst must be acting like the proper O2 sponge that it’s designed to be: PASSED TEST! Somewhere in the three-year development process for that engine and vehicle calibration, the closed loop diagnostic calibrator came up with the right value for this switching ratio that matches “good” emissions and properly lights the MIL in the event of a non-working catalyst and “bad” emissions.
So what does this mean when you’re getting the magical scan for the DMV? They just have to plug into the OBDII port and query the test history to find out whether your catalyst is leading to the right switching ratio between upstream and downstream sensors and they can determine the health of your catalyst without ever even putting the car on a hoist or emission sampler. The OBDII diagnostics are already keeping track of that for them.
Note: After I bolt the blower back on That Heavy Orange Thing I will get a better screen capture of the O2 switching.
6-25-2012 – WTF Does the Pythagorean Theorem Have to do With Passing Emissions?
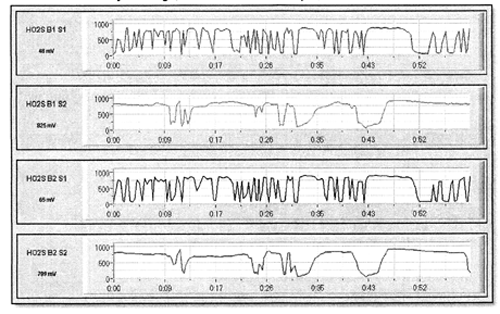
As promised, I got some clearer graphs of the front and rear O2 voltage signals. The graph below shows approximately 1 minute of data while cruising at a steady speed of 55mph. The blue trace is the front O2 sensor, and the orange trace is the rear.

It’s clear that the cat is modifying the oxygen content of the exhaust, but I was surprised to see that the number of “switches” (Voltage signal passing through stoich at .45 volts) was essentially the same. I’m sure you’re thinking “Of course it’s the same, that’s why it threw the code.”
But here’s the thing…it’s not this bank that threw the code, it’s bank2 shown below.

The rear sensor traces the front sensor nearly exactly which is the situation Greg describes above. You mean Greg was right? Imagine that!
Not willing to leave well enough alone, I wanted to put numbers on this so that I could look at a trace, and calculate whether or not a vehicle would pass the cat test. After a lot of digging, it turns out that it would depend on the vehicle. It seems that each manufacturer has come up with its own method of determining catalyst efficiency, and most have changed and refined their method over the years.
Some look at the number of switches, particularly with a set switch rate during the test, some consider the rate of change of voltage during the switch, and Toyota, and more recently Ford are using a parameter called “signal length.”
In all cases, the catalyst efficiency is based on a comparison between front and rear sensors, normally in the form of a ratio of rear to front signal characteristics.
Lucky for us Ford owners, Motorcraft provides a manual entitled OBD System Operation Summary – Model Year 2007 This manual details all the boring government mandated shit that makes your car complex and expensive.
These manuals are available online for model years 1996-2012, and contain a wealth of useful information, however boring it might be.
And now I realize it’s time to get some sleep, and I am nowhere near being done. Look for a continuation of the story in the next few days, and until then, download and print the manual for your car, (Or for all of them if you are a tuner.) and get a free education while you wait for me to finish this off.
Is that a cliffhanger?
Not quite. At least not until I add this.
When I come back, I’m going to describe Ford’s bastardization of the Pythagorean Theorem…and…tell you what parameters to change so that you pass the catalyst monitor even if your cats suck!
7-4-2012 – Playing Instead of Working
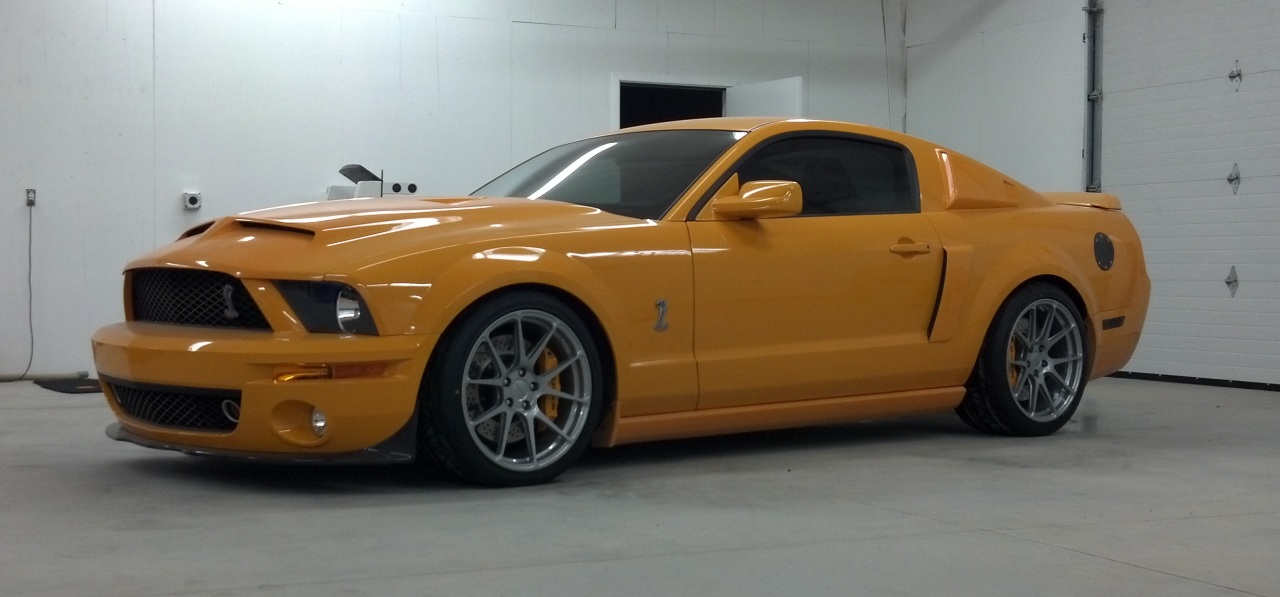
The wheels and suspension showed up. Instead of finishing the cat monitor description that I started above, I played with the car instead. Sorry…
Hats off to Forgeline for absolute perfect fitment.
And to Banish, who has been texting accusations of all manner of horrible things…see…it is ORANGE!
Yes the walls are white. No they are not padded.
Better pics, and a continuation of the catalyst monitor description to follow.
7-4-2012 – Guilty Conscience
My guilty conscience got the better of me, so I decided to finish the techno-babble that I started, and give you the easy way out if your cats are not up to the task.
Starting with the techno-babble, I mentioned that Ford was using the ratio of front to rear signal lengths to determine catalyst efficiency. We will get to the technical description of signal length soon enough, but for now, imagine that the O2 sensor voltage traces in the graphs above are pieces of string. Now simply stretch them out, and measure them.
Looking at the top graph which is Bank 1, it’s easy to imagine that the blue string would be longer than the orange, and that the difference between the two would be a good indicator of catalyst efficiency. Bank two on the other hand would give string lengths quite close to each other indicating poor catalyst efficiency. As a reminder, it is this bank that failed the catalyst test.
To understand how this is calculated, we can look to U.S. Patent Number 5,899,062 “Catalyst Monitor Using Arc Length Ratio of Pre- and Post-Catalyst Sensor Signals”
In this patent assigned to Ford Global Technologies, the method is described in detail. I will summarize.
The patent describes an interesting application of the Pythagorean Theorem where the derivative of time and voltage are defined as two of the three segments that make up a right triangle.
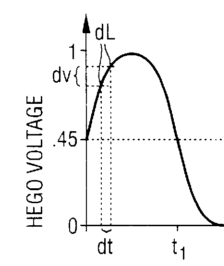
The formula below shows the suggested method of calculating the approximate incremental arc lengths, but the actual pass or fail determination is based on the ratio of the sum of arc lengths over a period of time. This time period is based on the number of switches, and is defined in the OBD System Operation Summary Manual listed in the 6-25-2012 post.
![]()
The threshold is determined during calibration as mentioned by Greg Banish in his description of the catalyst monitor system on 6-19-2012.
It looks good on paper, but there is a problem with this approach. It doesn’t seem to work very well!
A better description may be that it is not very robust. The problem is based on the fact that we are using different units for the x and y axis which skews its sensitivity towards either time or voltage depending on the units.
Using seconds and volts, we get a value of .914 for bank one, and .999 for bank 2. If we change our volt units to millivolts, we get .669 for bank one, and .837 for bank two. If we double our time increment from .01 seconds to .02 seconds we get .963 for bank one and 1.013 for bank two. Huh?
Luckily, a patent is not a description of current engineering policy, but a description of a new idea that may or may not be sorted out yet. A later patent changes the description to “signal length,” and provides the following formula.

The difference here is that the time and voltage increment are multiplied rather than added. As a result, the ratio is not sensitive to units.
Using this approach, the signal length ratios for the graphs shown above are .663 for bank one, and .814 or bank two.
Had enough?
OK, here’s how to get the catalyst efficiency monitor to run, and give you a passing grade so that the retards at the emissions test facility will send you home with a gold star and a smiley face.
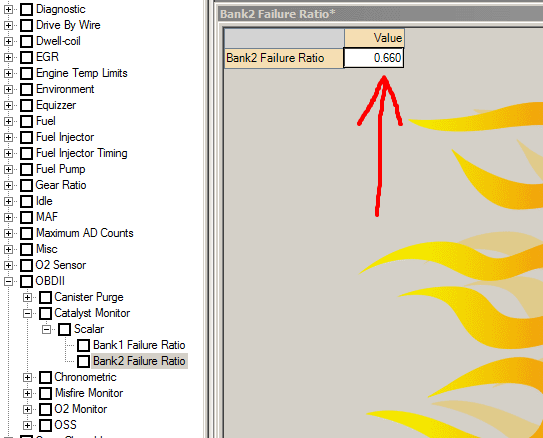
Change this value to one, and you’re golden.
Interestingly, the maximum value is two, which would mean that the rear sensor is showing twice as much activity as the front.
Hmmm.
7-28-2012 – Busy Being Green
It’s been nearly a month since this was updated.
I’ve been busy getting two cars through emissions so that I can continue to drive them legally.
It has been a long month, and this could easily turn into a page long rant, so I have decided to keep it short. It goes something like this…
Between my 2002 Miata, and this 2007 Mustang, I have wasted countless hours, burned through several tanks of gas, used up my limit of temporary permits, and missed a lot of sleep and work just to get a stupid sticker for my license plate.
To sum up…by the time I made my final trip to the emissions test facility, I was out of patience.
And once I got there, it just got better.
I was greeted by an overly friendly, morbidly obese, sweat drenched “technician” who acted as if he was working the front counter at Starbucks.
While he was taking my money and information, he chatted me up with a big drooling grin. “That’s a beautiful car…my father in law has a red one just like it…I bet the girls love it…do you have plans to drive it anywhere for the weekend?” And then he gave me $14 change, just to prove that he was as dumb as he looked.
He finally shut up as he was struggling to reach the OBDII port down by his knees which he probably hadn’t seen in years.
After fumbling around for what seemed like forever, he stepped out of the car leaving a shiny layer of sweat on my leather seat, handed me my paperwork, and said “Here you go sir, you passed, thank you for doing your part!”
“Thank you for doing your part?” I repeated in disbelief.
“As if I have a fucking choice!” I snapped, while seriously considering dropping him with a left hook to the body.
As enticing as the thought was, I kept my cool, and calmly got into my car and headed to the shop. During the drive I became increasingly angry as I thought about the time I had wasted complying with Federal Emissions Laws. Laws put in place by conniving, manipulative bureaucrats who spent their formative years doing bong hits while perusing “Cliffs Notes for The Communist Manifesto.”
I tried to console myself by visualizing Captain Chunk curled up on the floor clutching his liver, crying for his mommy, but that didn’t help.
The rage just kept building. And then, right about the time I decided to go back and force The Donut Whisperer to disinfect my seat at gunpoint while I set the place on fire, I had an epiphany.
I realized that if I continued to dwell on this, a blood vessel in my brain would burst, leaving me with the same mental capacity as Double Wide who had just given me $14 change from $40 for a $27 emissions test.

Doesn’t this look like fun? If only I had taken a picture of Lunch Box to share with all of you…
Back to my epiphany, I realize that even though I don’t give a fuck about being green, you might, some of your customers might, and surely some of my customers do. Besides, the stress of working on your car once a year to make it emissions compliant leads to thoughts of assault, arson, and childish name calling, at least one of which is a felony.
Wouldn’t it be nice if we could make big power without destroying our cats and O2 sensors? (Oh yeah, I forgot to mention the overheated failing bank 2 sensor…)
So my typically obsessive energy is now directed towards understanding catalytic converters. what type of cat is required to pass OBDII standards? How can we use the built in cat over-temp protection to keep them alive? Does it really have to cost power to do so?
Stay tuned to find out.
7-29-2012 – Thirteen Random Thoughts, And One WTF
Looking back over the month, I guess I’ve done more than just prep cars for emissions. I have spent time dialing in the suspension, removing weight, (from the car) contemplating the MBT spark table, ordering a drum of fuel that will allow me to test that MBT spark table, and throwing some high school math at the speed density tables to see what sticks.
So what does this amount to? Random thoughts, most of which are not worthy of a single entry on their own. Well…maybe a few of them. Anyway, suspend all expectations of order, and take note of these random facts and observations. If you have a moment, send me a message to let me know which, if any, are deserving of more attention.
1. – This car has the weight of an entire Mazda Miata on its two front tires.

2. – That equals 58% on the front tires, which leaves only 42% on the rear. It’s no wonder it doesn’t put the power down on corner exit.
3. – This beastly thing, known as the “Shaker 1000” sub box and amplifier weighs 55lbs. It now resides on a shelf next to the rear sway bar.
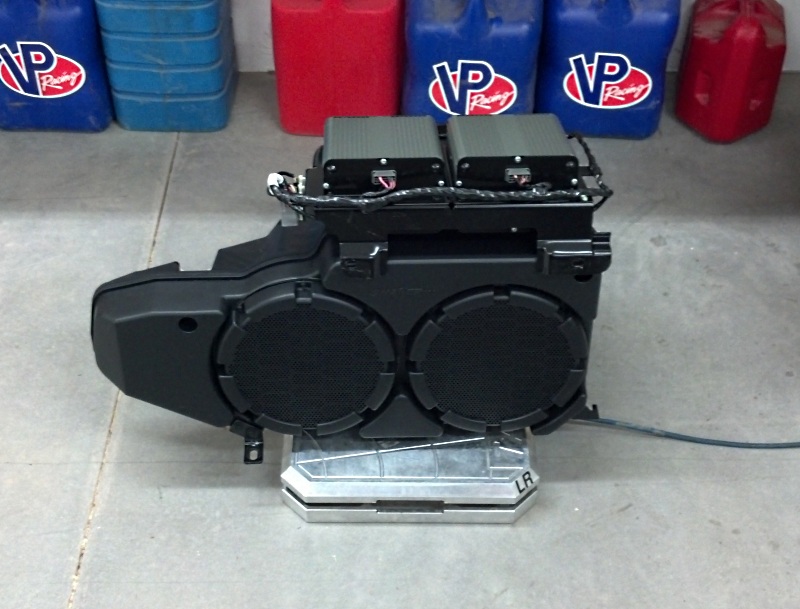
4. – A Nitto Invo 305/30 19 is not wider than a stock 285/40 18, but it sure does look cooler!
5. – Mounting your front shock reservoirs under the hood is dumb.
6. – Mounting your rear shock reservoirs next to the exhaust is even dumber.
7. – Routing the pressurized line from your methanol tank 1/2″ from the exhaust is the dumbest of all.
8. – The lowest rear ride height setting on the Eibach Pro kit leaves you resting on the bump stops with 2.1″ of available bump travel.
9. – A rear ride frequency of 3.1 Hz will offset this limited bump travel, and works quite well. (Well enough to allow removal of the bump rubbers, leaving you with a linear predictable rate)
10. – A front ride frequency of 3.4 Hz will compliment the astronomical rear ride frequency, and might also work well. Or it might suck. I’ll let you know next week.
11. – The Nitto Invo 285/30 19 does not seem happy supporting the nose of a GT500. Especially at the pressures listed on the door jamb.
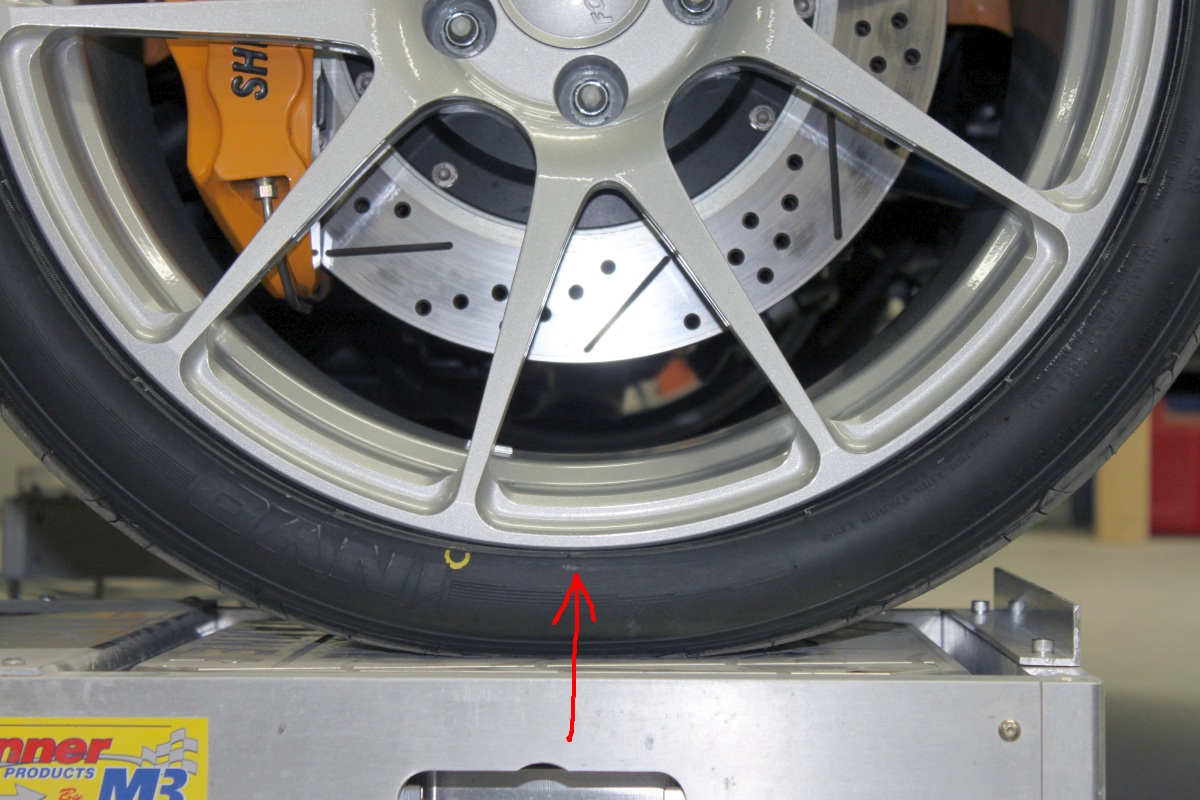
12. – The rear tires have no such problem.
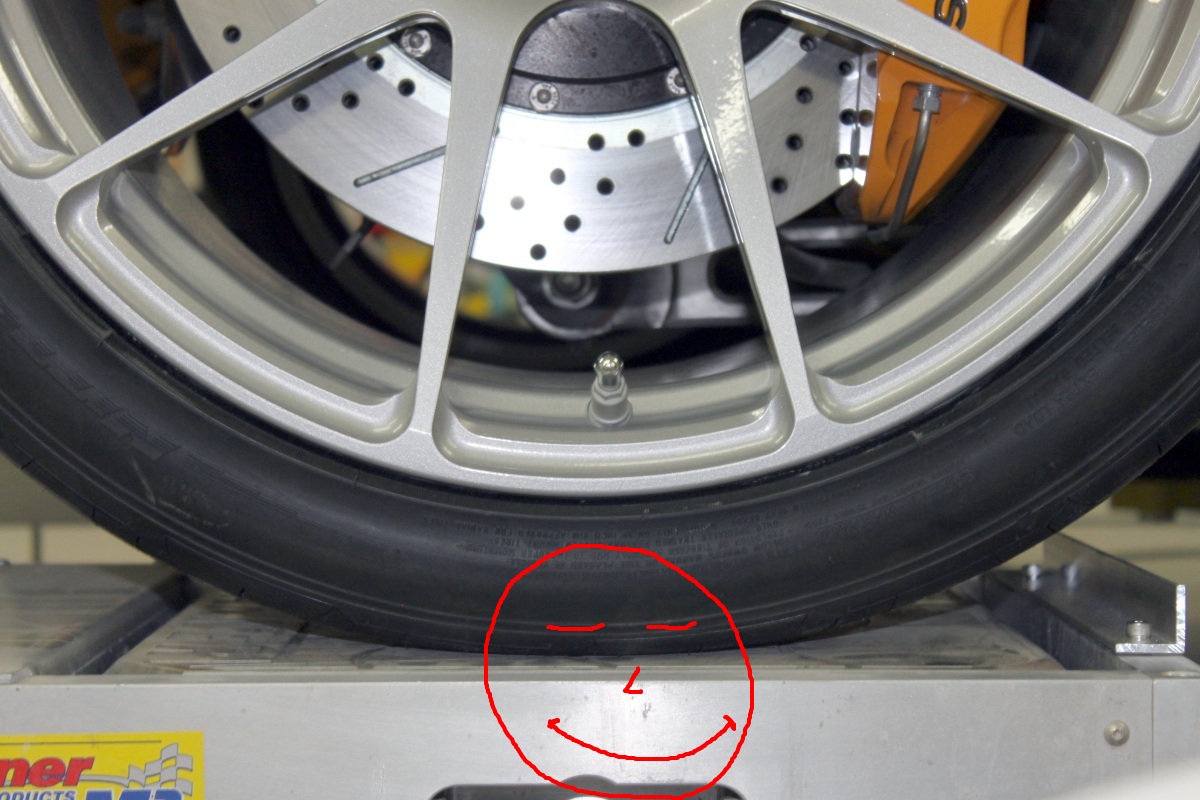
13. – Even when your car is filthy, Forgeline Wheels make it look cool.

Now for the WTF – If you export Fords linear slope-intercept speed density tables into Excel, and poke and prod a bit, you will find a conventional VE table buried within.
8-12-2012 – Math Doesn’t Suck

Math is quite useful, even fun. If you’re a dork.
I’m a dork.
Who can do useful things.
Like generate a traditional VE curve from Ford’s linear slope-intercept air charge model.
Interested yet? In the VE table, or scantily clad women dressed as teachers? In either case, read on, you will not be disappointed.
Ford’s version of speed density is quite clever, ignoring volumetric efficiency and getting straight to the point, which is air mass. After all, we don’t calculate air fuel ratio based on volume, we calculate air fuel ratio based on mass. So why bother with a volume term?
U.S. Patent Number 6,115,664 “Method of Estimating Engine Charge” details the method, and for those who don’t like interpreting “patent language,” I will translate. I will also present pictures of hot math teachers so that you don’t get bored.
Fords method is based on the observation that for a given RPM, a plot of manifold pressure vs cylinder air mass lies on a straight line.
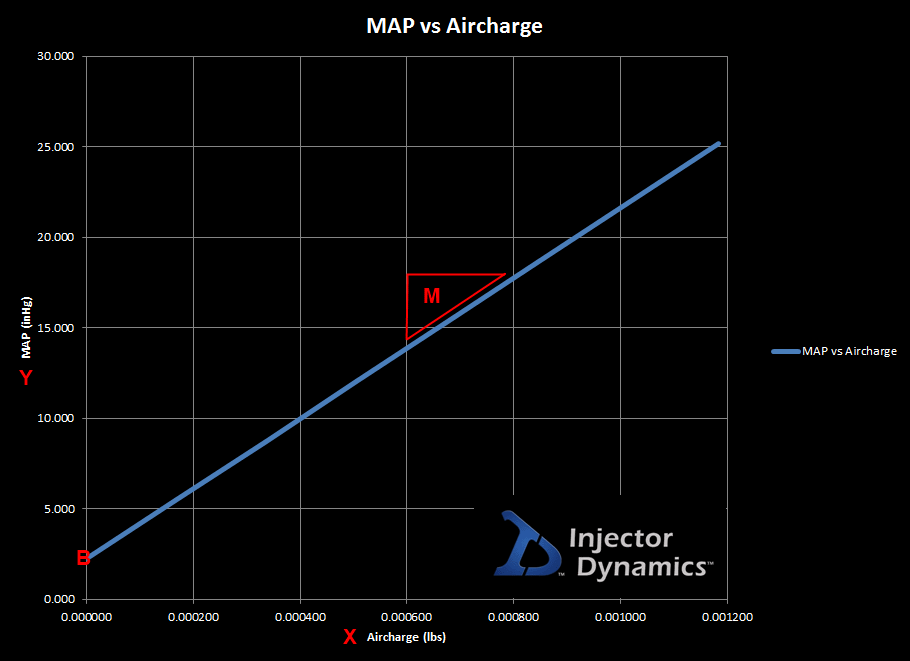
This line can be defined using the traditional slope-intercept form, known as y = mx + b
Where:
y = Manifold Absolute Pressure, or MAP, in inches of mercury.
m = “Slope of MAP vs Aircharge,” in inches of mercury, per pound, per induction event.
x = Cylinder Air Mass, or Aircharge in pounds.
b = y intercept, or “MAP at Zero Aircharge” in inches of mercury.
Note: If you need a better description of the Slope-Intercept formula, a Google search will get you a quick answer.
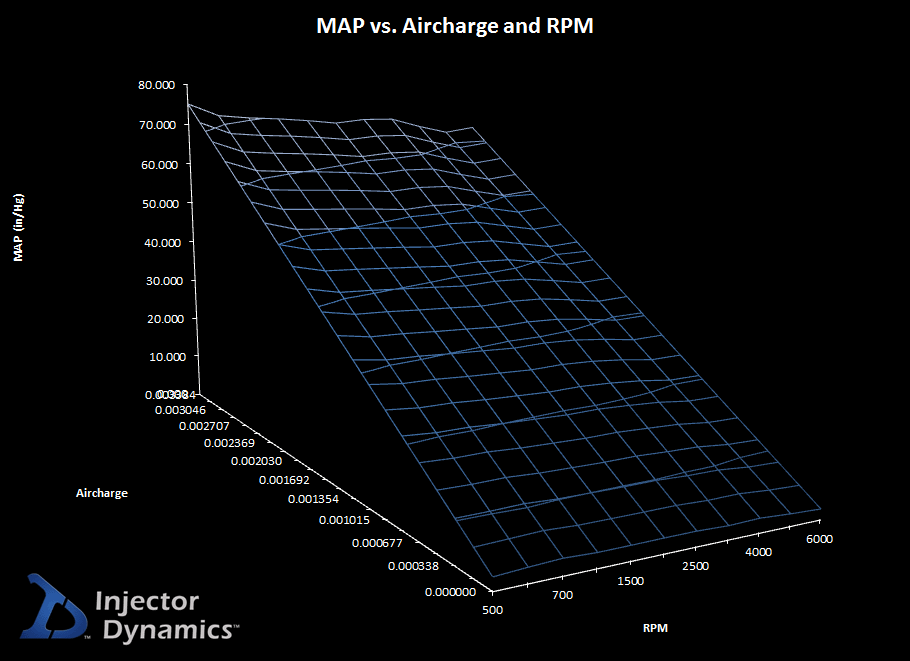
Using the values for an FBMH356 strategy, we can plot MAP vs Aircharge across the RPM range, which produces the following surface.
Doesn’t look like a VE table does it? That’s because it’s not. We’re still a few steps away.
The first thing we need to do is solve for aircharge, instead of MAP. Rearranging the slope-intercept formula to solve for aircharge, we get x = (y – b) / m
Which produces the following surface.
Note that if we modify this further by dividing aircharge by engine displacement, we have load vs MAP and RPM.
Isn’t math fun?

Before we move on to the VE curve, let’s take a moment to discuss engine displacement which is uniquely defined by Ford.
Ford states displacement as lbs per induction event at 100% VE, under standard temperature and pressure conditions. Just not the standard temperature and pressure conditions you may be used to. Not SAE J607 (60 F, 29.921 inHg) not SAEJ1349 (77 F, 29.234 inHg) not even the more obscure J1995 (77 F, 29.53 inHg) No…that would be too much like everyone else. Ford’s standard is 100 F, and 29.921 inHg.
Why those values? I have no idea, but I have always appreciated Ford’s willingness to do it their way. It’s refreshing to see a company blaze their own path instead of following standards that haven’t been questioned in generations. (e.g. Maurice Olley’s pioneering work with Cadillac in the 30’s that seems to guide GM’s spring and damper choices to this day.)
Oops…just lost a few Corvette customers.
Back to the task at hand, if you were wondering how to calculate displacement Ford style, here it is.
1. – Calculate the density of dry air at 100F and 29.921 inHg.
1.326 * (29.921 / (100 + 459.7)) = .07089 lbs/ft^3
2. – Multiply this by the single cylinder volume displacement in ft^3.
For a 330 cubic inch, 8 cylinder engine – (330 / 8) / 1728 = .02388 ft^3
3. Multiply air density by single cylinder volume displacement.
.07089 * .02388 = .001692 lb
Simplified – (Displacement in cubic inches / Number of Cylinders) / 24392
So now we get to the final steps. The steps that take us to the old familiar VE table. There’s only one problem.
It’s midnight, and i’m tired.
That’s two problems isn’t it?
I guess you’ll have to tune in next week!

8-20-2012 – No Boobies, Just Math and Physics
This installment could have waited another week or so. At least that’s what I thought until I checked my mail.
It seems that every gearhead with a Mustang and an email account wants to see a nice curvy VE surface along with an explanation of how it is derived. Judging from the tone of these emails, it also seems that I should drop whatever I am doing to make that happen.
Since you’re all so insistent that I finish this article, you get no boobies! That’s right, just math and physics.
Suck it up boys, and prepare to crunch some numbers.
Before we get too far, I think it’s important for everyone to ask themselves the following question. “Do I really understand the meaning of the term volumetric efficiency?”
If you answered no, that’s ok, because i’m going to ‘splain it to you.
And i’m going to start by taking us straight to Google for a definition.
Using volumetric efficiency definition as search terms, Google spat out the following.
Dictionary.com – The ratio of air or gas-air mixture drawn into the cylinder of an internal-combustion engine to the volumetric displacement of the piston.
The Free Dictionary – (Engineering / Automotive Engineering) The ratio of air or gas-air mixture drawn into the cylinder of an internal-combustion engine to the volumetric displacement of the piston.
Wikipedia – Volumetric efficiency in internal combustion engine design refers to the efficiency with which the engine can move the charge into and out of the cylinders. More specifically, volumetric efficiency is a ratio (or percentage) of what quantity of fuel and air actually enters the cylinder during induction to the actual capacity of the cylinder under static conditions.
So what has Google done for us?
Nothing but waste our time, without furthering our knowledge. Granted, we could memorize these definitions, and blurt them out like a parrot whenever the subject comes up. Chances are no one would ever question them, and so we could assume that we have an accurate understanding.
Please consider the following.
Using these definitions, could you accurately calculate volumetric efficiency given the required parameters? Would you even know what parameters are required to perform the calculation?
Absolutely not, and here’s why.
The first two definitions while not incorrect, are incomplete. The Wikipedia definition on the other hand is a typical load of Wikicrap, no better than a forum search where the most popular opinionis assumed to be correct.
Lucky for us, a couple of gentleman from MIT made great efforts to understand the internal combustion engine, and published the results of their research to the benefit of all.
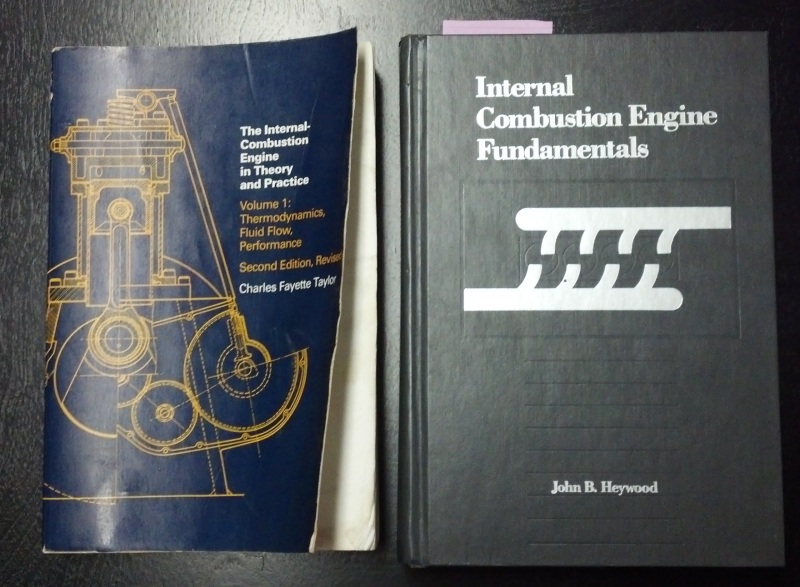
In my far from humble opinion, these books are required reading for anyone building engines, or tuning them. Heywood’s book builds on Taylor’s which arrived about twenty years earlier, and the two together form a very complete reference.
Put them on your Christmas list. They are a value at any price, representing a lifetime of knowledge from men who were very serious about their work. I can say without reservation that they will serve you for a lifetime. (Unless you change professions…)
Let’s see how Taylor defines volumetric efficiency.
“In terms of quantities applying to an actual engine, volumetric efficiency is defined as the mass of fresh mixture which passes into the cylinder in one suction stroke, divided by the mass of this mixture which would fill the piston displacement at inlet density”.
He then goes on to express this algebraically which I will skip here. (Buy the book!)
He continues, defining inlet density.
“Volumetric efficiency is of chief interest as a measure of the performance of the cylinder assembly as an air-pumping device. in order to evaluate this quantity, it is necessary to define the inlet density as the density of fresh mixture in or near the inlet port. When inlet density is determined in this manner the resulting volumetric efficiency measures the pumping performance of the cylinder and valves alone.”
“As is explained later, it may not always be convenient, or even possible, to measure inlet density at the inlet port. However, density can always be measured in the atmosphere near the air intake to the engine. When inlet density is measured at this point the resulting volumetric efficiency measures the flow performance of all the equipment in the system between air intake and cylinder, as well as the pumping performance of the cylinder itself. The volumetric efficiency based on this method of measurement is called the over-all volumetric efficiency.”
20 years later, Heywood gives a similar explanation, ending with the following.
“The inlet density may either be taken as atmosphere air density (in which case volumetric efficiency measures the pumping performance of the entire inlet system) or may be taken as the air density in the inlet manifold (in which case volumetric efficiency measures the pumping performance of the inlet port and valve only).”
So why do each of these definitions include mass and density when we have always been told that VE is about volume?
Because air is elastic and will expand to fill its container. This is one of the defining properties of a gas.
For that reason, The volume of air in the cylinder is always exactly equal to the volume of the cylinder.
What we are really measuring is the change in air density that results from the various restrictions to the flow of air entering the cylinder.
Let’s apply this to the Ford model and see what gives.
Remember this graph from the “Math Doesn’t Suck” article?
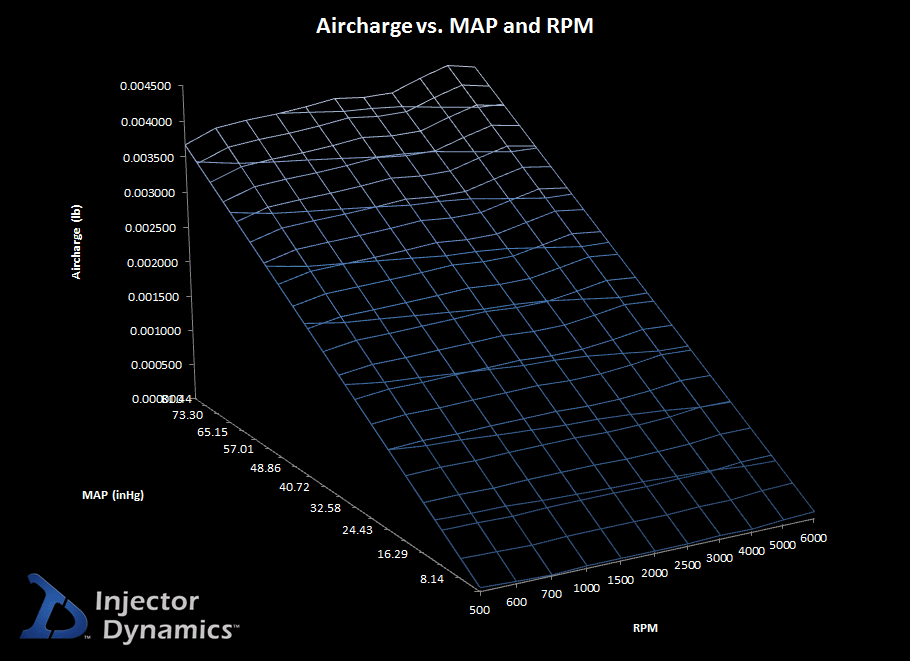
This graph shows aircharge vs. MAP and RPM, and includes nearly everything required to calculate VE. Following Taylor’s instruction, we can divide aircharge (“the mass of fresh mixture which passes into the cylinder in one suction stroke”) by displacement as defined by Ford (“the mass of this mixture which would fill the piston displacement at inlet density”) to arrive at VE stated as a ratio. If we multiply this ratio by 100, we get VE stated as a percent.
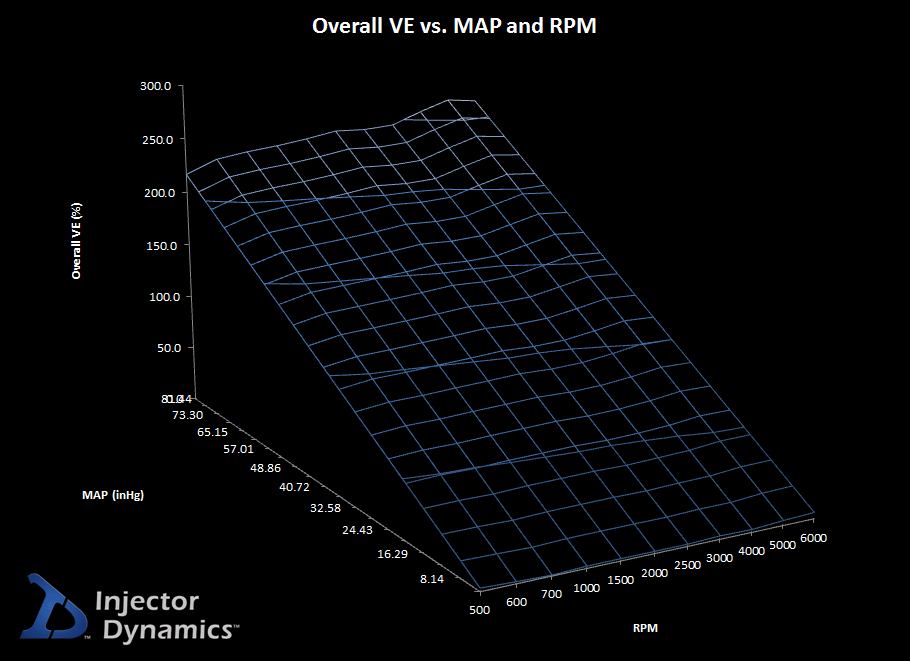
Which gives us Overall Volumetric Efficiency
Still flat as a board.
Knowing the difference between VE, and Overall VE as defined by Taylow and Heywood, let’s calculate and plot VE and see what it looks like.
Once again following Taylor’s instruction, we divide aircharge by inlet density, but this time we will define inlet density based on conditions in the intake manifold. Using the values at 16.29 inHg (55.2 kPa, or 8.00 psi) and 3000 RPM for our example, we start by calculating the air density at 16.29 inHg, at the Ford standard temperature of 100 F.
1.326 * (16.29 / (100 + 459.7)) = .03859 lbs/ft^3
Next we multiply the air density by the cylinder volume.
.03859 * .02388 = .0009215 lb
Which gives us (“the mass of this mixture which would fill the piston displacement at inlet density”)
Now that we have defined this term, we divide it into our aircharge value.
.000696 / .0009215 = .755
Which gives us volumetric efficiency stated as a ratio. The final step of multiplying this value by 100 gives us VE stated as a percent which is 75.5%
If we take the time to perform those same calculations at every breakpoint, we get VE vs. RPM and MAP
Which looks exactly like the traditional VE table that we are used to. It was right in front of us the whole time. We only had to change our point of reference (air density) to see it.
Isn’t math cool?

10-26-2012 – The Non-Update
Sorry guys. I have been, and still am busy preparing for the PRI show at the end of November. I have a big ass booth to build, three seminars to compose, and a million other little details to attend to.
If you want to be notified of updates, keep an eye on my Facebook page where I will inform my “friends” of new activity.
7-2-2013 – They come in red too…
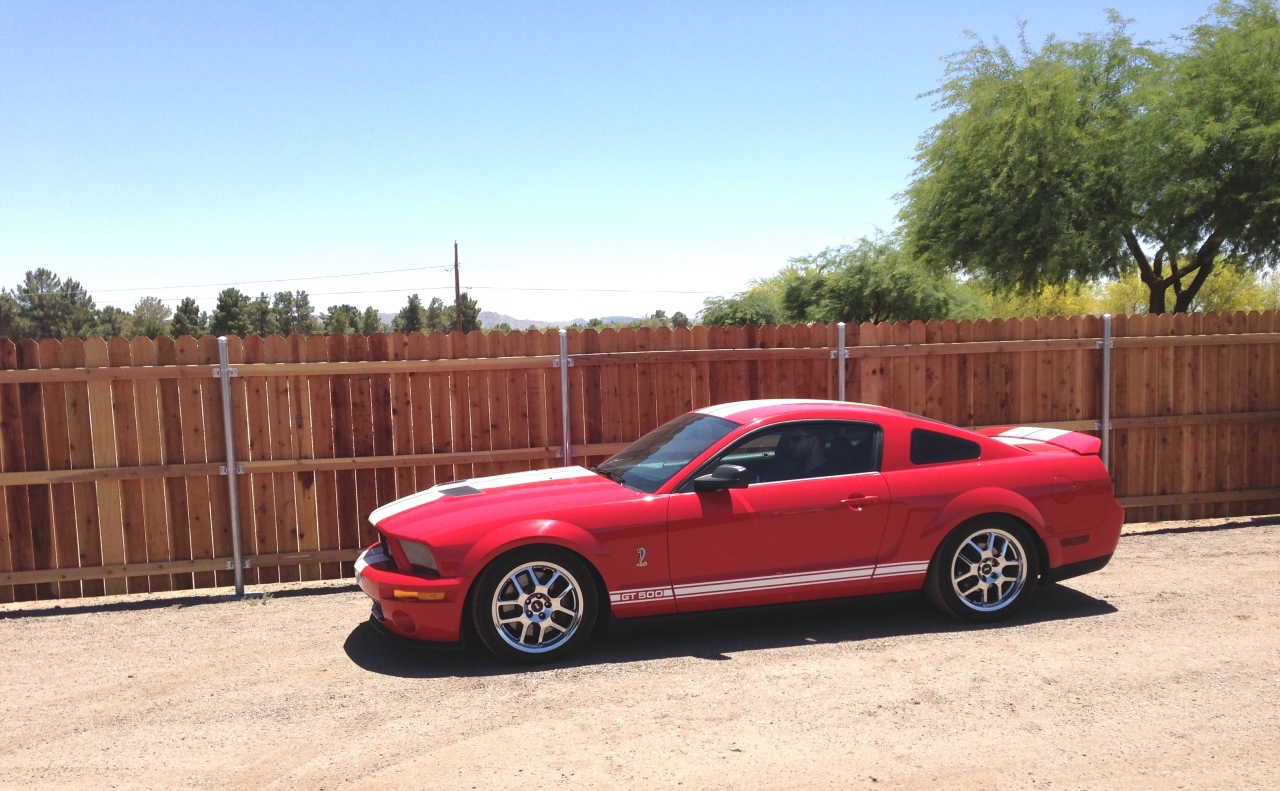
With stripes even!
As you can see, I found another one. This one with 7,200 miles on the odometer, and only three aftermarket parts! That’s right, only three.
So what did I do…get out my credit card and order a bunch of cool new parts???
Fuck no. I ordered a set of stock springs to replace the Eibachs, a stock air box to replace the K&N hot air intake, and a stock panhard bar to replace the Bob Bitchin’ adjustable squeak and rattle generator that was on the car.
And now I am the proud owner of a bone stock, low mileage, six year old car.
It’s slow as shit, it handles like shit, the brakes suck, and not surprisingly, the stereo sounds like shit, so what’s the point?
It looks cool for one, but if you read the mindless babbling from previous updates, you should know it makes a PERFECT test vehicle.
And what do you do with a perfect test vehicle? You fill the tank with emissions certification fuel – which is what it was originally calibrated with – and you log every thing imaginable to see just what it is that Ford finds acceptable. If you can’t learn anything from that exercise, you may as well throw away your “Yes I Are a Tooner” T-Shirt and find a new job. Or…do the global community a huge favor and shoot yourself in the face.
So what jumped out at me when I started logging? Other than the horrific wheel hop, I noticed that Ford did quite a nice job. But…I also noticed some severe swings in fuel trims as the fuel temperature changed. Severe as in swings exceeding 18% at low pulse widths.
This is particularly troublesome to me, because if I am to use this vehicle for testing and validation, I need consistency.
Luckily, the problem was right in front of me, or least made available to me by SCT. Anyone recognize these tables?
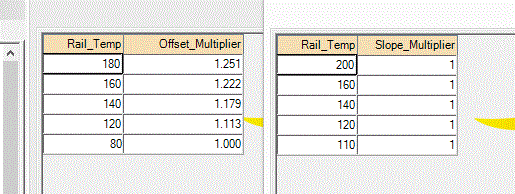
Here is a problem with these tables, and the problem is that…well…they are fucked up.
So I fixed them, and everything is fine now. Goodnight.
All right, i’m kidding. I did fix them, and everything is fine now, but the implications are far reaching, and the explanation requires some detail which I will happily go into in the next week or so. The result of this will be better more consistent tunes for all of us.
In the meantime, read the article at the end of this newsletter as it describes the meat of the problem, and provides most of the solution.
And if you haven’t done so already, wander over to my Facebook page and click all the appropriate buttons so that you will be notified when I finish the rest of this geekfest.
To be continued…
Paul Yaw
Injector Dynamics

