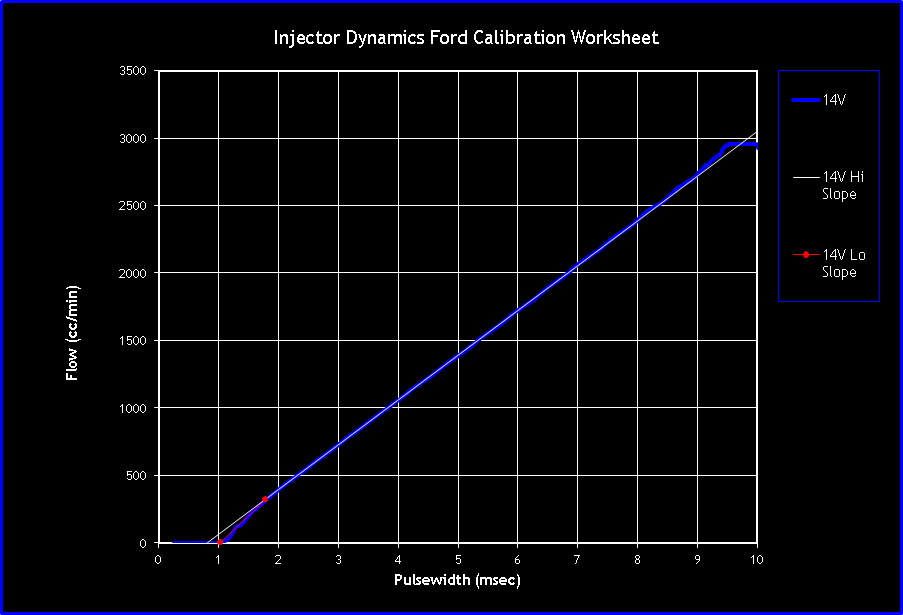
Ford’s method of characterizing fuel injectors is unique, and elegantly simple. Especially if you have a picture to refer to. What you see below is a screenshot of the worksheet we use to develop Ford injector characterization files.

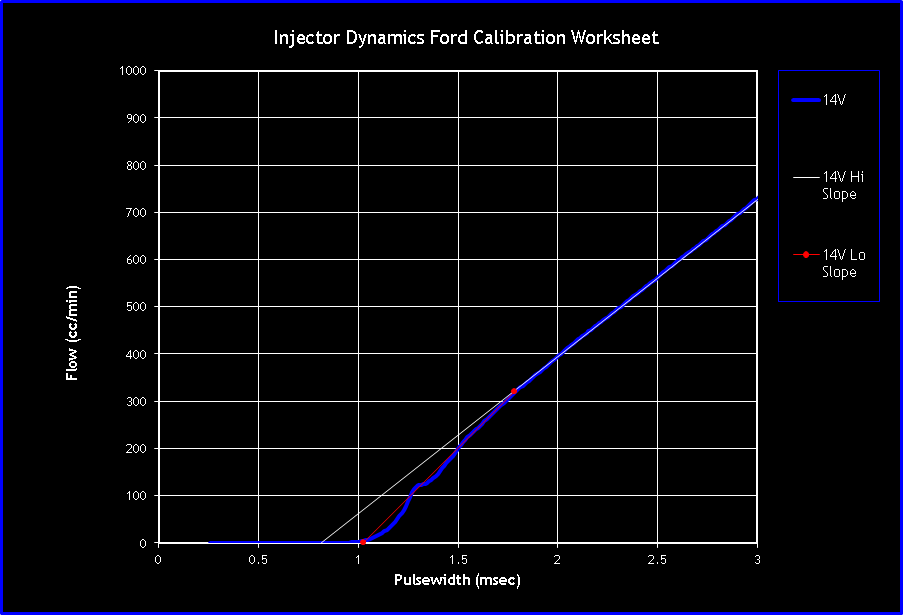
The blue line is the raw flow vs pulse width curve for our ID2000 injector at 14V, 100Hz, 7bar fuel pressure.
The white line is the high slope which is a straight line approximation of the linear portion of the flow vs pulse width curve.
The red line with markers is the low slope which is a straight line approximation of the lower non linear portion of the flow vs pulse width curve.
The red dot at the top of the low slope is the breakpoint.
The red dot at the bottom of the low slope line is the offset.
The minimum pulse width is the represented by the knee of the flow vs pulsewidth curve which occurs at approximately 1.3 msec. This is the pulse width required to fully open the injector, and below this pulse width the flow is somewhat erratic and unpredictable.
What Ford has done is to approximate the injector characteristics with 2 straight lines, and a defined crossing point which is the breakpoint. Scrolling down to the picture below you can see a zoomed in version of the same screen capture.

With this data the pulse width required for a given fuel flow is calculated by the ECU. If any of this data is wrong, the amount of fuel delivered by the injector will be wrong.
This can be especially tricky in the low slope range.
If we are using large injectors we will spend a lot of time operating in this range, so the data better be spot on.
Thanks for reading.
Paul Yaw
Injector Dynamics
